Brightness is an appearance. The modality explains what it means.
X-ray / Ionizing radiation
A projection through the body
A radiograph combines the structures along each beam path into one image. Start with projection and positioning before interpreting an apparent difference.
CT reconstructs a volume from many X-ray measurements. A slice separates anatomy by depth; a display window chooses which attenuation values receive visible contrast.
Window level sets the centre of the displayed range.
Window width sets how broad that range is.
Changing a display window does not require a new exposure.
Clinical connection
CT can depict lung, bone, soft tissue and vessels. The scan protocol and contrast timing depend on the question being asked.
What it cannot tell you
Motion, metal and partial-volume effects can obscure detail. A JPEG of one slice does not contain the complete examination or its original HU data.
Safety & contrast
CT uses ionizing radiation. When iodinated contrast is considered, the team reviews relevant reaction history, kidney function and the clinical context.
Unenhanced CT and contrast-enhanced CT answer different questions. Contrast timing is part of the acquisition, not a display setting.
Try explaining it
Keep a phantom voxel fixed while changing the window. Explain why its stored value stays the same while its shade changes.
MRI uses a magnetic field, radiofrequency excitation and spatial encoding to form images. Read the sequence label first; bright signal has different meanings on different acquisitions.
Compare T1 and T2 weighting rather than treating MRI as one appearance.
FLAIR suppresses the signal from free fluid such as CSF.
Interpret diffusion-weighted images alongside the ADC map and other sequences.
Clinical connection
A multiparametric examination combines complementary sequences. It may include pre- and post-contrast images, diffusion or other specialised acquisitions.
What it cannot tell you
Motion and susceptibility can degrade images. Sequence names, timing, field strength and fat suppression affect appearance.
Safety & contrast
Device safety depends on the exact implant and scanning conditions. MR Conditional does not mean safe in every scanner or protocol; formal screening remains necessary.
Many MRI examinations can be performed without contrast. When indicated, gadolinium-based agents require their own safety assessment.
Try explaining it
Compare fluid signal across T1, T2 and FLAIR. Then explain why DWI brightness alone is not proof of restricted diffusion.
Near-field structures appear closer to the top of a conventional image.
Brightness describes returning echoes, not CT attenuation.
Doppler evaluates motion; colour must be read against the displayed scale.
Clinical connection
Ultrasound supports real-time assessment, Doppler evaluation and image-guided procedures. Transducer choice and the acoustic window shape what can be seen.
What it cannot tell you
Gas and bone limit many acoustic windows. Operator technique, angle, gain and depth influence the examination.
Safety & contrast
Diagnostic ultrasound does not use ionizing radiation. Appropriate output and examination duration still matter.
Many studies use no injected agent. Contrast-enhanced ultrasound is a separate technique using ultrasound contrast agents.
Try explaining it
Rotate the illustrated probe from a long-axis to a short-axis view. Predict how the same vessel changes shape on the screen.
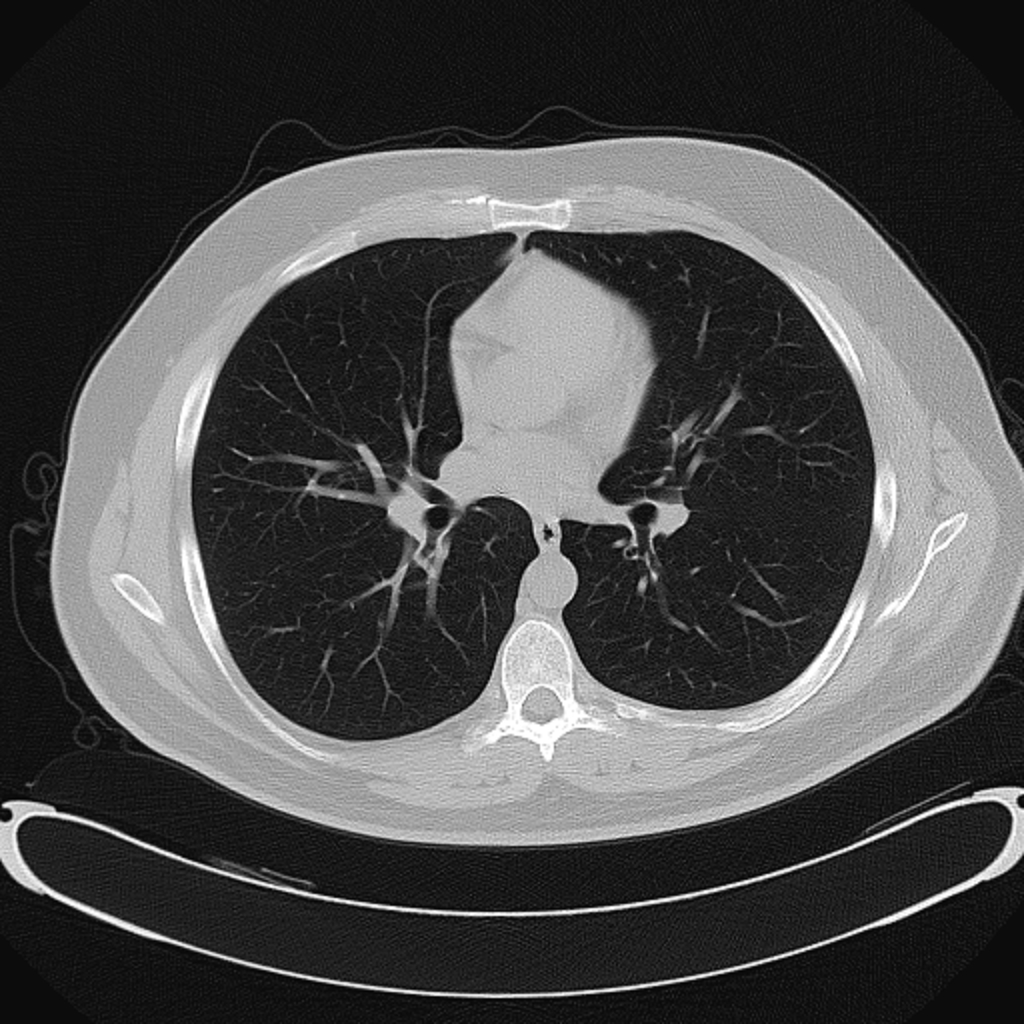
An axial chest CT displayed in a lung window, showing branching pulmonary vessels against air-filled lungs. This is a fixed display image, not raw CT data; it cannot support true Hounsfield-unit windowing.
Notice skull brightness on CT and fluid signal on T1 versus T2 MRI. The images differ in patient, level and acquisition; they are not registered.
CT
Noncontrast head CT
Axial noncontrast head CT with a sagittal locator, from a source series described as normal. Dense skull and darker brain tissue illustrate CT attenuation differences.
Axial T1-weighted brain MRI acquired at 7 Tesla. This independent example shows dark ventricular fluid and gray–white matter contrast; it is not paired with the T2 example.
Axial T2-weighted brain MRI at the lateral ventricles. Ventricular fluid is bright. This is a different source study and slice level from the T1 example.
Compare a CT cross-section with a longitudinal ultrasound view. The CT shows a renal cyst; the ultrasound is a separate normal-kidney example.
CT
Renal cyst on CT
Axial abdominal CT with a left renal cortical cyst identified by the source. This is a pathology example, not a normal counterpart to the ultrasound image.
Normal adult kidney on ultrasound. Original source labels: * column of Bertin, ** pyramid, *** cortex, **** sinus; the dashed line measures renal length.
Synthetic models for learning. No patient data or clinical measurements.
SYNTHETIC CT PHANTOM
Assigned teaching values · not patient anatomy
CT window & level
Choose which values share the visible grayscale. The underlying assigned HU values stay fixed.
Presets are illustrative display choices, not scan protocols. Section control changes this synthetic object's geometry.
Stored value → displayed grayscale (0 black, 255 white)
Insert
Assigned HU
Shade
Model uses the DICOM default LINEAR window function, displayed as MONOCHROME2. The library's JPEG/PNG scans contain fixed display pixels, not calibrated HU data.
CONCEPTUAL SIGNAL SWATCHES
CSF
White matter
Gray matter
DWI BrightADC Low
Corresponding high DWI + low ADC supports restricted diffusion in context.
Illustrative relative shades, not quantitative MRI signal
Sequence changes meaning
Choose a sequence to compare its usual teaching pattern.
Check sequence labels, plane, slice level and technical quality before comparing. Real acquisitions vary with sequence parameters, field strength and fat suppression.
Clinical connection: projection and positioning can change the apparent cardiac silhouette. Technique must be considered before concluding that heart size has changed.
SCHEMATIC VESSEL IN B-MODE
Ideal straight vessel · no Doppler data
The plane follows the probe
A plane along a straight vessel's length creates an elongated lumen.
Rotating the probe to a perpendicular plane can show the same vessel in cross-section. Confirm the probe marker and screen convention in the actual examination.
Doppler reminder: red and blue encode the selected flow scale, not oxygenation. Read the scale and direction relative to the probe.
04 / APPLY THE PRINCIPLE
Twelve moments to think it through.
Read the question. Explain your reasoning. Then reveal the teaching point.
12 fictional teaching scenarios · independent of the real scan library
XRAY / FICTIONAL SCENARIO
Why are the ribs bright?
On a fictional chest teaching image, ribs look lighter than the air-filled lungs. What produces that difference?
Reveal the reasoning
Different X-ray attenuation along the beam path.
Bone attenuates more of the beam than air-filled lung. On the usual radiographic display this produces lighter bone and darker lung. These are projected shadows, not a direct photograph.
A fictional portable AP chest image shows a larger cardiac silhouette than an earlier PA image. Does the apparent change alone prove true heart enlargement?
Reveal the reasoning
No. Check projection and acquisition differences first.
AP geometry can magnify the cardiac silhouette. Comparing apparent size across AP and PA images without considering technique can mislead.
In a fictional wrist lesson, a radiograph shows no visible fracture. Does this exclude a tendon injury?
Reveal the reasoning
No. Radiographs have limited ability to show many soft-tissue injuries.
A radiograph answers some questions well but cannot establish that every tissue is normal. Further evaluation depends on the clinical examination and the question being asked.
In the windowing lab, the same synthetic CT values look different when you change from a broad window to a narrow one. Has the tissue changed?
Reveal the reasoning
No. The mapping from values to display shades changed.
A narrow window spreads a smaller input range across the available grayscale. Values outside that range are clipped at the display extremes. The original values remain unchanged.
A learner says that contrast for CT and contrast for MRI are interchangeable because both make anatomy easier to see. What is missing?
Reveal the reasoning
The agent and imaging mechanism are different.
Iodinated agents commonly enhance CT by altering X-ray attenuation. Gadolinium-based agents commonly enhance MRI by changing magnetic properties. Screening is specific to the agent, patient and examination.
A fictional lesion is bright on a diffusion-weighted image. Can you call it restricted diffusion from that image alone?
Reveal the reasoning
No. Review the ADC map and the other sequences.
DWI brightness can reflect T2 shine-through. Corresponding reduced ADC supports restricted diffusion, but the pattern still needs anatomical and clinical context; it is not a diagnosis by itself.
A fictional patient brings an implant card marked MR Conditional. Does that mean scanning is allowed with any MRI setup?
Reveal the reasoning
No. The exact device conditions must be checked and satisfied.
MR Conditional describes safety under specified conditions. Device identity, manufacturer labeling and the site's MRI safety process determine whether the proposed examination meets those conditions.
A fictional MRI sequence has blurred tissue boundaries after movement. Should every indistinct edge be read as abnormal anatomy?
Reveal the reasoning
No. Consider motion-related image degradation.
MRI collects data over time. Movement can reduce interpretability. Compare other sequences and assess technical quality before assigning significance to an apparent finding.
A fictional color Doppler display shows one vessel segment in red and another in blue. Does this identify arterial versus venous oxygenation?
Reveal the reasoning
No. Read the color scale and flow direction relative to the probe.
Color Doppler encodes motion information. A color does not independently establish vessel identity or oxygen content; changing the display convention can reverse the colors.
A fictional scanning demonstration compares dry probe contact with gel contact. Why does coupling gel help?
Reveal the reasoning
It reduces intervening air between the probe and skin.
Air at the interface disrupts transmission into the body. Gel improves acoustic coupling so emitted sound and returning echoes can pass between the transducer and tissues.
During a fictional abdominal ultrasound lesson, bowel gas obscures part of an organ. Is the unseen region proven normal?
Reveal the reasoning
No. An incomplete acoustic window limits the examination.
Gas can disrupt ultrasound transmission. Distinguish a structure that was assessed and appeared normal from a structure that was not adequately visualized.
Created by Satvik Tripathi with AI assistance. This is an introductory learning resource, not a diagnostic viewer or an imaging-ordering tool. Models simplify physics; cases are fictional. Source review and software checks are not independent clinical validation.